Features › Reports and oversight
Included in the core
Your figures, ready to present
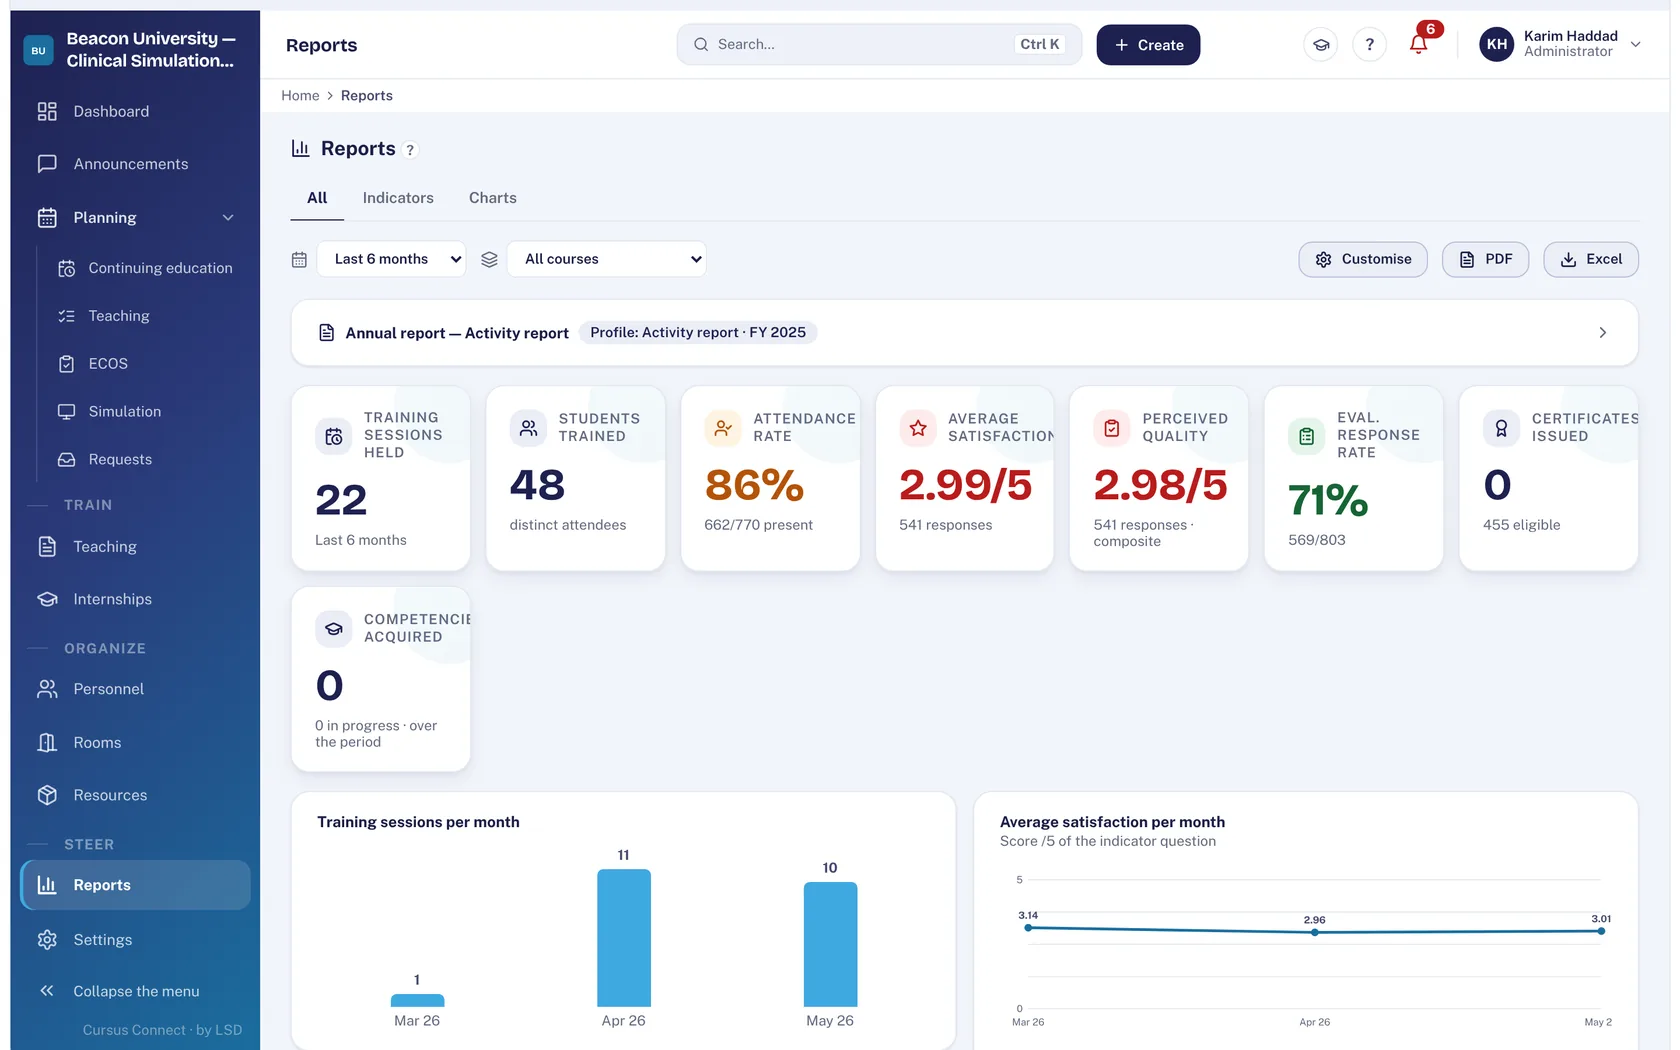
Courses delivered, learners trained, attendance, satisfaction, room occupancy: indicators are computed from the real data of your screens. You choose the period; the report comes out as PDF, Word or Excel.
Today
- The annual report is rebuilt by hand from four files.
- The pedagogical and financial return takes a week of retyping.
- Management asks for a figure; it takes a day to produce it.
With Cursus Connect
Indicators are computed per period and per course from your data; nothing is entered separately. The activity report, the BPF and the SRC statistics come out ready to send, and each profile’s dashboard shows what concerns it.
How it works
1
Choose the period
Last six months, year, courses: indicator groups adjust. Each account keeps its widgets.
2
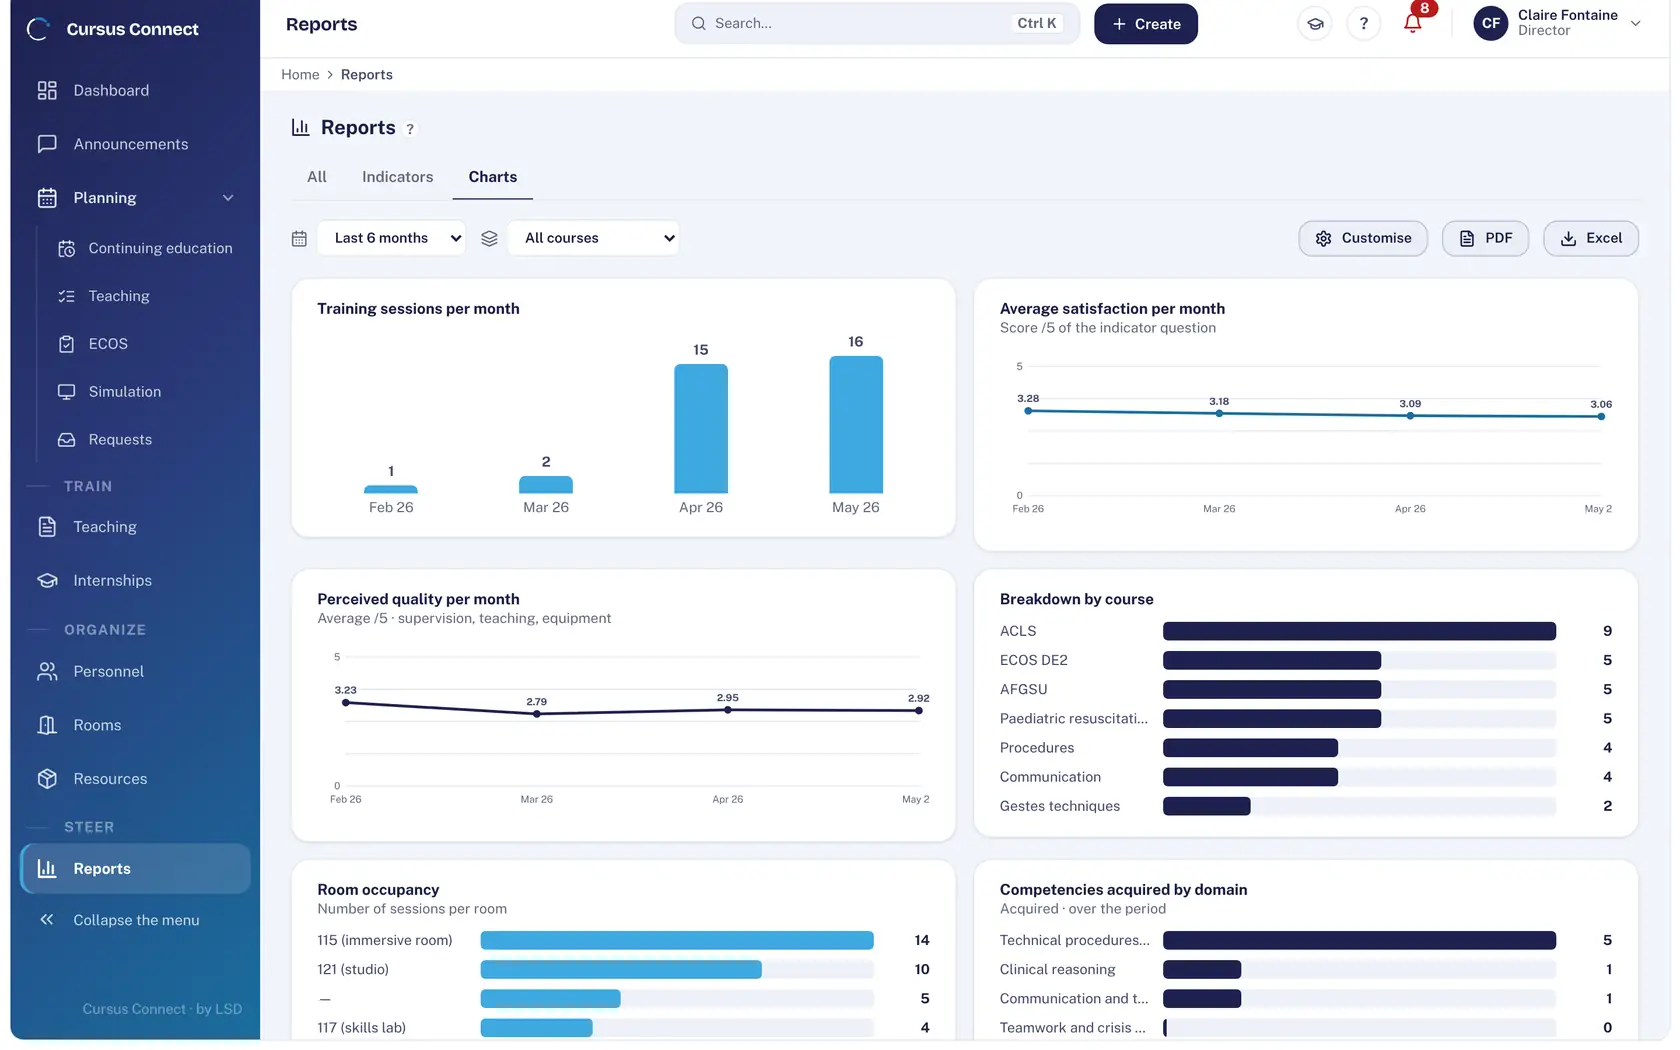
Read the charts
Courses per month, satisfaction, perceived quality, breakdown by course, room occupancy, skills acquired.
3
Export for your authority
Activity report as PDF and Word; BPF (Cerfa 10443) as PDF and Excel, pedagogical part computed and financial part pre-filled from invoices; annual review and SRC BLS-AED statistics for Switzerland.
What you gain
Indicators with nothing retyped
They are computed from the real data of your screens.
The BPF prepared
Pedagogical part computed, financial part pre-filled; filing remains to be done on Mon Activité Formation.
SRC statistics
Count of the year’s BLS-AED-SRC certificates, as Excel and PDF.
A dashboard per profile
Tiles chosen, moved and resized by each account.
Exports for every use
PDF for management, Excel for reworking, Word for the report.
Evidence for quality
Attendance, satisfaction and cold impact feed the evidence file of the Quality module.
More time to teach
What you no longer do by hand
- Activity report as PDF and Word, in one click.
- BPF prepared from courses and invoices.
- SRC statistics counted automatically.
- Widgets remembered for each account.
Your data, under lock and key
What is guaranteed
- Indicators are derived from the data; no figure is entered separately.
- Each profile sees only the indicators its rights allow.
- Exports are written to the audit log.
- Data stays in Europe, at OVHcloud.
Frequently asked questions
Can we add our own indicators?
The indicators are Cursus Connect’s, computed from your data; Excel exports allow any reworking.
See your center in Cursus Connect
An online demo built around your courses, your OSCEs and your documents. You leave knowing what Cursus Connect will change for you.